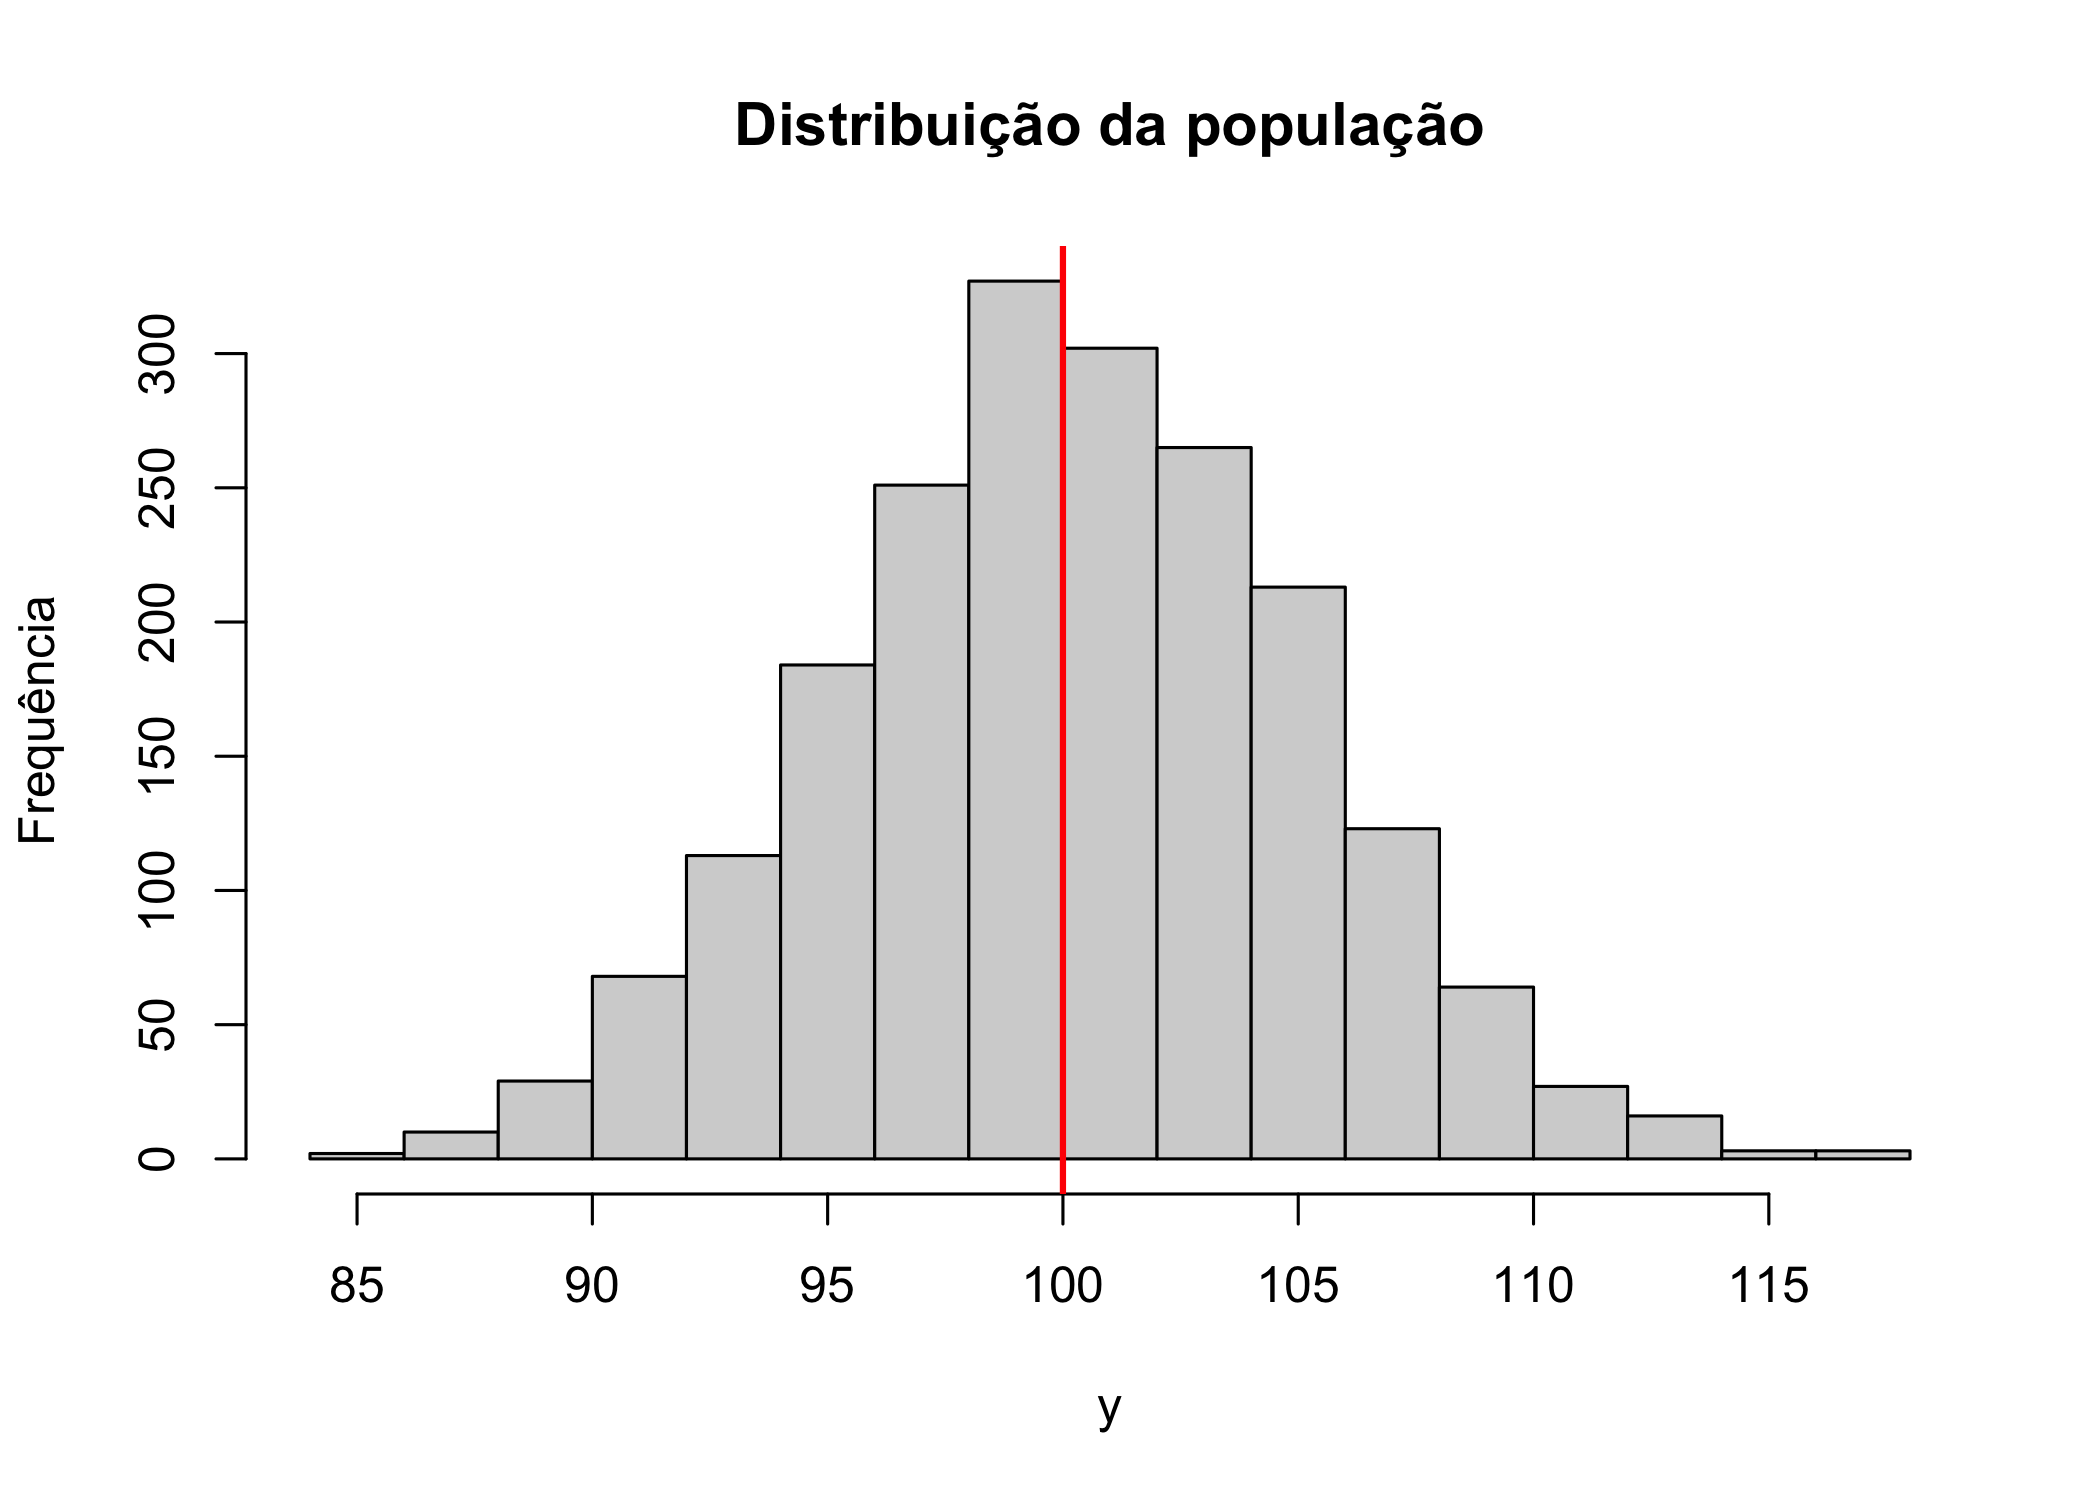
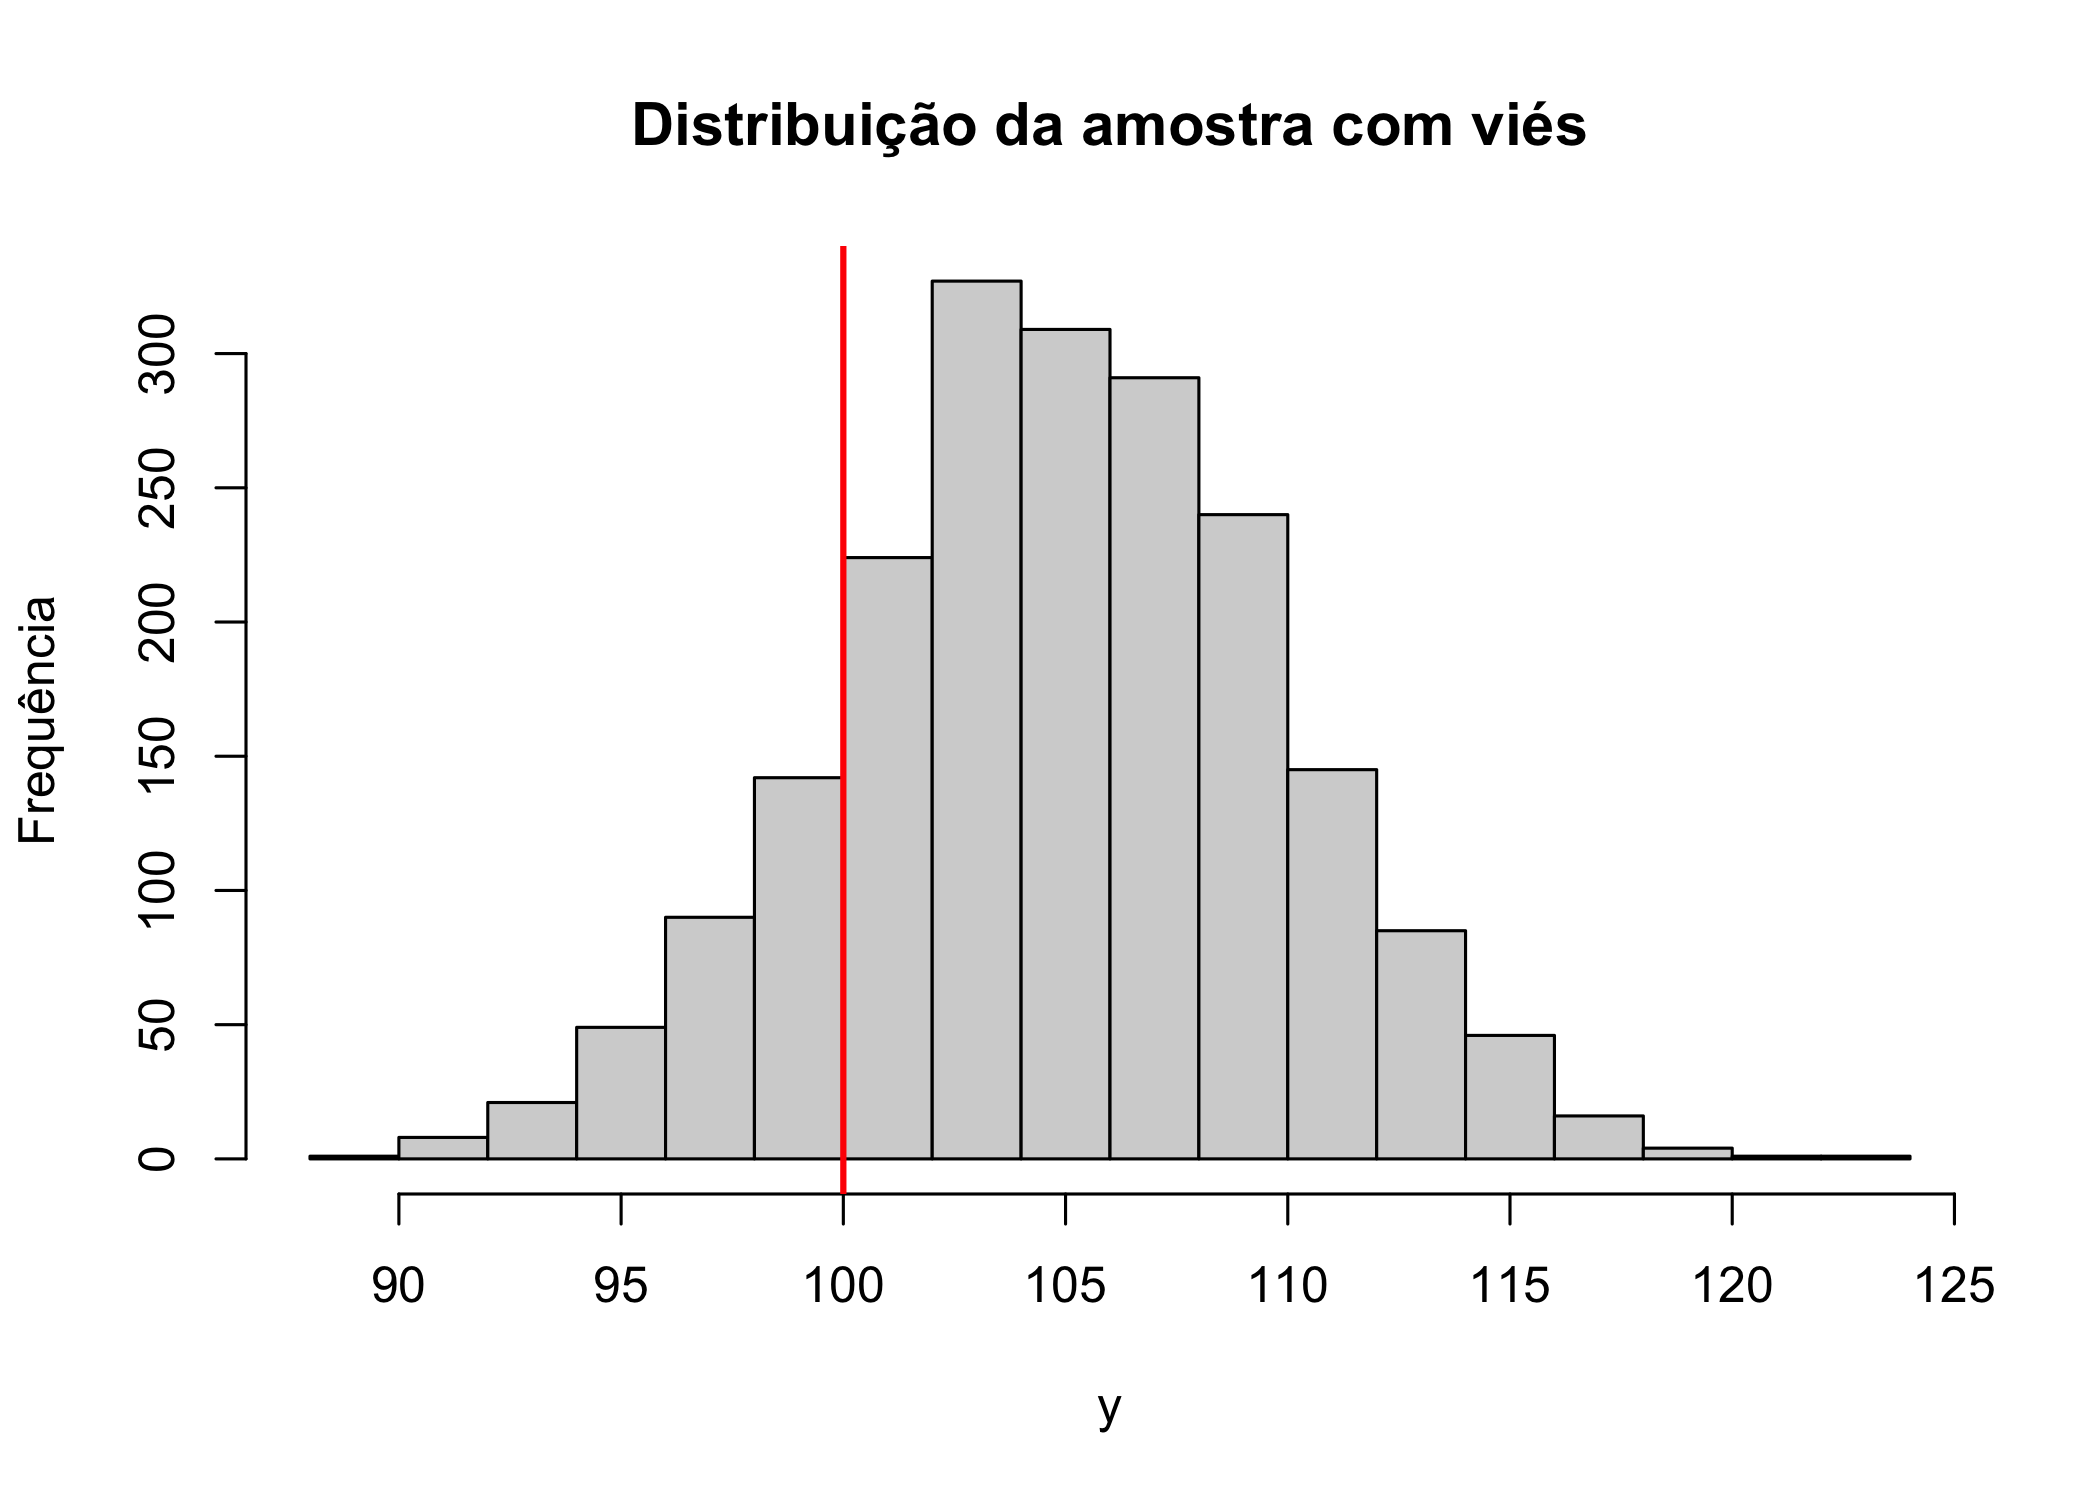
Groves et al. (2011), cap. 2
Sample surveys combine the answers of individual respondents in statistical computing steps to construct statistics describing all persons in the sample. At this point, a survey is one step away from its goal – the description of characteristics of a larger population from which the sample was drawn. (Groves et al. 2011, 40)
There two inferential steps are central to the two needed characteristics of a survey:
Answers people give must accurately describe characteristics of the respondents.
The subset of persons participating in the survey must have characteristics similar to those of a larger population.
When either of these two conditions is not met, the survey statistics are subject to “error”. The use of the term “error” does not imply mistakes in the colloquial sense. Instead, it refers to deviations of what is desired in the survey process from what is attained. “Measurement errors” or “errors of observation” will pertain to deviations from answers given to a survey question and the underlying attribute being measured. “Errors of nonobservation” will pertain to the deviations of a statistic estimated on a sample from that on the full population. (Groves et al. 2011, 40–41)
[About constructs] Some constructs are more abstract than others. The Survey of Consumers (SOC) measures short-term optimism about one’s financial status. This is an attitudinal state of the person, which cannot be directly observed by another person. It is internal to the person, perhaps having aspects that are highly variable within or across persons […]. In contrast, the National Survey on Drug Use and Health (NSDUH) measures consumption of beer in the last month. (Groves et al. 2011, 42)
However, survey measurements are often questions posed to a respondent, using words […]. The critical task for measurement is to design questions that produce answers reflecting perfectly the constructs we are trying to measure. These questions can be communicated orally […] or visually […]. Sometimes, however, they are observations made by the interviewer. […]. (Groves et al. 2011, 42–43)
Sometimes, the responses are provided as part of the question, and the task of the respondent is to choose from the proffered categories. Other times, only the question is presented, and the respondents must generate an answer in their own words. Sometimes, a respondent fails to provide a response to a measurement attempt. This complicates the computation of statistics involving that measure. (Groves et al. 2011, 43)
O texto comenta sobre detecção de anomalias on the fly, permitindo que o respondente corrija o erro. Por exemplo, se o usuário indica que nasceu em 1890.
The frame population is the set of target population members that has a chance to be selected into the survey sample. In a simple case, the “sampling frame” is a list of all units (e.g., people and employers) in the target population. Sometimes, however, the sampling frame is a set of units imperfectly linked to the population members. FOr example, the SOC has as its target population the U.S. adult household population. It uses as its sampling frame a list of telephone numbers. (Groves et al. 2011, 44)
A sample is selected from a sampling frame. This sample is the group from which measurements will be sought. In many cases, the sample will be only a very small fraction of the sampling frame (and, therefore, of the target population). (Groves et al. 2011, 44)
Agora, pensando do ponto de vista de qualidade de um survey…:
The job of a survey designer is to minimize error in survey statistics by making design and estimation choices that minimize the gap between two successive stages of the survey process. This framework is sometimes labeled the “total survey error” framework or “total survey error” paradigm. (Groves et al. 2011, 47)
In short, the underlying target attribute we are attempting to measure is \(\mu_i\), but instead we use an imperfect indicator, \(Y_i\), which departs from the target because of imperfections in the measurement. When we apply the measurement, there are problems of administration. Instead of obtaining the answer \(Y_i\), we obtain instead \(y_i\), the response to the measurement. We attempt to repair the weakness of the measurement through an editing step, and obtain as a result \(y_{ip}\), which we call the edited response (the subscript \(p\) stands for “postdata collection”). (Groves et al. 2011, 47)
In statistical terms, the notion of validity lies at the level of an individual respondent. It notes that the construct (even though it may not be easily observed or observed at all) has some value associated with the \(i\)th person in the population, traditionally labeled as \(\mu_i\), implying the “true value” of the construct for the \(i\)th person. When a specific measure of \(Y\) is administered, simple psychometric measurement theory notes that the result is not \(\mu_i\), but something else:
\(Y_i = \mu_i + \epsilon_i\) (Groves et al. 2011, 48)
For example, the answer to a survey question about how many times one has been victimized in the last six months is viewed as just one incident of the application of that question to a specific respondent. In the language of psychometric measurement theory, each survey is one trial of an infinite number of trials. […]. We do not really administer the test many times; instead, we envision that the one test might have achieved different outcomes from the same person over conceptually independent trials. (Groves et al. 2011, 48)
Validity is the correlation of the measurement, \(Y_i\), and the true value, \(\mu_i\), measured over all possible trials and persons: \(\mathbb{E}[(Y_{it} - \bar{Y})(\mu_i - \mu)] / [\sqrt{\mathbb{E}(Y_{it} - \bar{Y})^2} \sqrt{\mathbb{E}(\mu_i - \mu)^2}]\) (Groves et al. 2011, 48)
[…] When \(y\) and \(\mu\) covary, moving up and down in tandem, the measurement has high construct validity. A valid measure of an underlying construct is one that is perfecly correlated to the construct. (Groves et al. 2011, 48)
To the extent that such response behavior is common and systematic across administrations of the question, there arises a discrepancy between the respondent mean response and the true sample mean. (Groves et al. 2011, 49)
Os autores comentam também sobre fontes de erro na etapa de codificação de respostas abertas. “The processing or editing deviation is simply \((y_{ip} - y_{i})\).” (Groves et al. 2011, 50)
Alguns detalhes são importantes sobre a sampling frame. Em particular, se os bancos de dados utilizados não são atualizados com frequência, podemos esbarrar em problemas de não observação. Por exemplo, se o banco de dados não é atualizado, podemos acabar ligando para pessoas que já morreram ou mudaram de endereço. (Groves et al. 2011, 51)
In statistical terms for a sample mean, coverage bias can be described as a function of two terms: the proportion of the target population not covered by the sampling frame, and the difference between the covered and noncovered population. […] […] For example, for many statistics on the U.S. household population, telephone frames describe the population well, chiefly because the proportion of nontelephone households is very small, about 5% of the total population. Imagine that we used the Surveys of Consumers, a telephone survey, to measure the mean years of education, and the telephone households had a mean of 14.3 years. Among nontelephone households, which were missed due to this being a telephone survey, the mean education level is 11.2 years. Although the nontelephone households have a much lower mean, the bias in the covered mean is:
\(\bar{Y}_C - \bar{Y} = 0.05(14.3 - 11.2) = 0.16\)
or, in other words, we would expect the sampling frame to have a mean years of education of 14.3 years versus the target population mean of 14.1 years. (Groves et al. 2011, 51)
For example, the National Crime Victimization Survey sample starts with the entire set of 3067 counties within the United States. It separates the counties by population size, region, and correlates of criminal activity, forming separate groups or strata. In each stratum, giving each county a chance of selection, it selects sample counties or groups of counties, totaling 237. All the sample persons in the survey will come from those geographic areas. Each month of the sample selects about 8300 households in the selected areas and attempts interviews with their members. (Groves et al. 2011, 52)
As with all the other survey errors, there are two types of sampling error: sampling bias and sampling variance. Sampling bias arises when some members of the sampling frame are given no chance (or reduced chance) of selection. […]. Sampling variance arises because, given the design for the sample, by chance many different sets of frame elements could be drawn. (Groves et al. 2011, 52)
The extent of the error due to sampling is a function of four basic principles of the design:
Whether all sampling frame elements have known, nonzero chances of selection into the sample (called “probability sampling”)
Whether the sample is designed to control the representation of key sub-populations in the sample (called “stratification”)
Whether individual elements are drawn directly and independently or in groups (called “element” or “cluster” samples)
How large a sample of elements is selected
A variância amostral da média é dada por: \(\dfrac{\sum^S_{s=1} (\bar{y_s} - \bar{y_c})^2}{S}\)
Nonresponse error arises when the value of statistics computed based only on respondent data differ from those based on the entire sample data. For example, if the students who are absent on the day of the NAEP measurement have lower knowledge in the mathematical or verbal constructs being measured, then NAEP socres suffer nonresponse bias, they systematically overestimate the knowledge of the entire sampling frame. If the nonresponse rate is very high, then the amount of the overestimation could be severe. (Groves et al. 2011, 53)
Em resumo: os componentes de qualidade de survey são provenientes de erros de observação e de não observação. Erros de observação incluem gaps entre construtos, medidas, respostas e respostas editadas. Erros de não observação incluem erros de cobertura, amostrais e não resposta. (Groves et al. 2011, 54)
Sample surveys rely on two types of inference – from the questions to constructs, and from the sample statistics to the population statistics. The inference involves two coordinated sets of steps: obtaining answers to questions constructed to mirror the constructs, and identifying and measuring sample units that form a microcos of the target population.
Despite all efforts, each of the steps is subject to imperfections, producing statistical errors in survey statistics. The errors involving the gap between the measures and the construct are issues of validity. The errors arising during the application of the measures are called “measurement errors”. Editing and processing errors can arise during efforts to prepare the data for statistical analysis. Coverage errors arise when enumerating the target population using a sampling frame. Sampling errors stem from surveys measuring only a subset of the frame population. The failure to measure all sample persons on all measures creates nonresponse error. “Adjustment errors” arise in the construction of statistical estimators to describe the full target population. All of these error sources can have varying effects on different statistics from the same survey. (Groves et al. 2011, 56)